Did ICC favor specific teams in their world cup 2019 schedule? - an statistical analysis.
Cricket is a big sports in Bangladesh. At the moment of writing, cricket world cup 2019 is going on and Bangladesh is doing quite well in the group stage. As such, it is a hot topic for idle discussions in my workplace. During one such chat sessions, one of my colleagues made an interesting but provocative comment -
India is going to have an easy time with ICC world cup 2019, simply because
ICC favored them with a nice schedule.
It is no secret that Bangladeshi cricket fans consider two of the neighboring country teams as their main rivals - India and Pakistan. But, could it be true? The only way to find out is to talk to the data - I thought.
Wait! Why does scheduling matter?
Beats me. The popular conjecture is that - if a team gets too little rest in-between matches, players get tired and perform worse as the tournament progresses. But you don’t want too much rest either. If the brake between subsequent matches is too big, team loses momentum and might perform worse. So, ideally, each team wants to have some ideal amount of idle days in-between matches - not too much and not too little.
Whether this conjecture is true or false - I don’t know. Nor am I interested in proving it. What interests me is comparative analysis of rest days between subsequent plays for the participant teams.
Input Data
| Date | Team 1 | Team 2 |
|---|---|---|
2019-05-30 | ENG | SA |
2019-05-31 | PAK | WI |
2019-06-01 | SL | NZ |
2019-06-01 | AFG | AUS |
2019-06-02 | BAN | SA |
2019-06-03 | PAK | ENG |
2019-06-04 | SL | AFG |
2019-06-05 | SA | IND |
2019-06-05 | BAN | NZ |
2019-06-06 | AUS | WI |
2019-06-07 | PAK | SL |
2019-06-08 | ENG | BAN |
2019-06-08 | AFG | NZ |
2019-06-09 | IND | AUS |
2019-06-10 | SA | WI |
2019-06-11 | BAN | SL |
2019-06-12 | AUS | PAK |
2019-06-13 | IND | NZ |
2019-06-14 | WI | ENG |
2019-06-15 | AUS | SL |
2019-06-15 | AFG | SA |
2019-06-16 | IND | PAK |
2019-06-17 | WI | BAN |
2019-06-18 | ENG | AFG |
2019-06-19 | SA | NZ |
2019-06-20 | AUS | BAN |
2019-06-21 | SL | ENG |
2019-06-22 | IND | AFG |
2019-06-22 | NZ | WI |
2019-06-23 | PAK | SA |
2019-06-24 | BAN | AFG |
2019-06-25 | AUS | ENG |
2019-06-26 | ENG | PAK |
2019-06-27 | WI | IND |
2019-06-28 | SL | SA |
2019-06-29 | PAK | WI |
2019-06-29 | NZ | AUS |
2019-06-30 | ENG | IND |
2019-07-01 | SL | WI |
2019-07-02 | BAN | IND |
2019-07-03 | ENG | NZ |
2019-07-04 | AFG | WI |
2019-07-05 | PAK | BAN |
2019-07-06 | SL | IND |
2019-07-06 | ENG | SA |
Process
I hand parsed the schedule for the group stage into a Clojure hash-map and calculated the gaps between subsequent plays for each team. After that, means, medians and variances for each gap series was calculated and plotted side by side for comparison. This was my first data analysis project with Incanter, yet I found it surprisingly easy to grasp. The whole thing took 45 minutes at best - from planning to production. Thanks to awesomeness of Clojure and Incanter.
Analysis
Comparison of average gap between matches
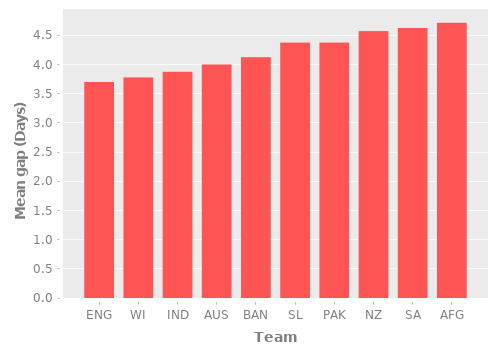
If we compare the mean gap between matches for each team, we can see that it’s fairly uniform. The difference between maximum and minimum values are approximately one day. The teams who gets lowest mean gaps are - England, West Indies and India. Afghanistan, South Africa and New Zealand gets to enjoy long leisure times. Bangladesh sits somewhere in the middle.
Comparison of median gap between matches
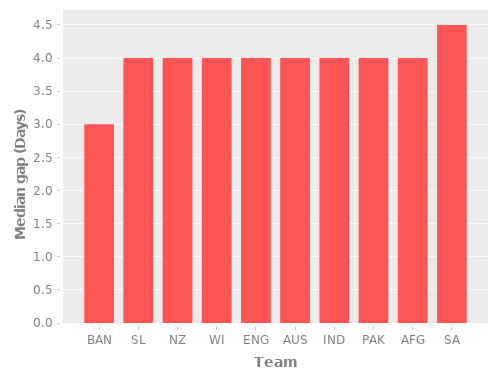
Comparison of median gaps is not very useful. Most teams get a median gap of four days, except Bangladesh and South Africa.
Comparison of variance of gap between matches
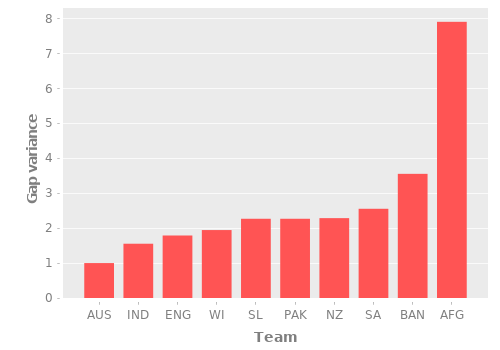
If we compare variance between gaps for each team, we get an interesting picture. As you can see, Australia, India, England and West Indies gets a low gap variance below 2, in order. On the other hand, South Africa, Bangladesh and Afghanistan gets wildly varying gaps. Look at the column for Afghanistan!
Conclusion
Well, from the above analysis, I think it’s clear that Bangladesh does not get a schedule worse than most teams. So, the statement/hypothesis we were trying to proof has no definite basis.
But there are some rather interesting conclusions we can draw from the variance chart. Note the teams with lowest gap variance - these are the teams who make the most money for ICC, in terms of viwership earnings. Could it be? Well here’s my conclusion -
ICC world cup 2019 schedule was optimized for viewership engagement.
Think about it. Say, you were handed the job of creating a schedule. Also, your boss wants you to maximize profit with the schedule. If a fan favorite team drops early you lose viewership. So, you want to delay the eventual outcome of group stage for the fan favorite teams. You collect relative number of viewers/fans for each country and sort them in a descending manner. Take the team with most viewers and spread them out uniformly in the group stage. You take the next team and do the same. And so on.